
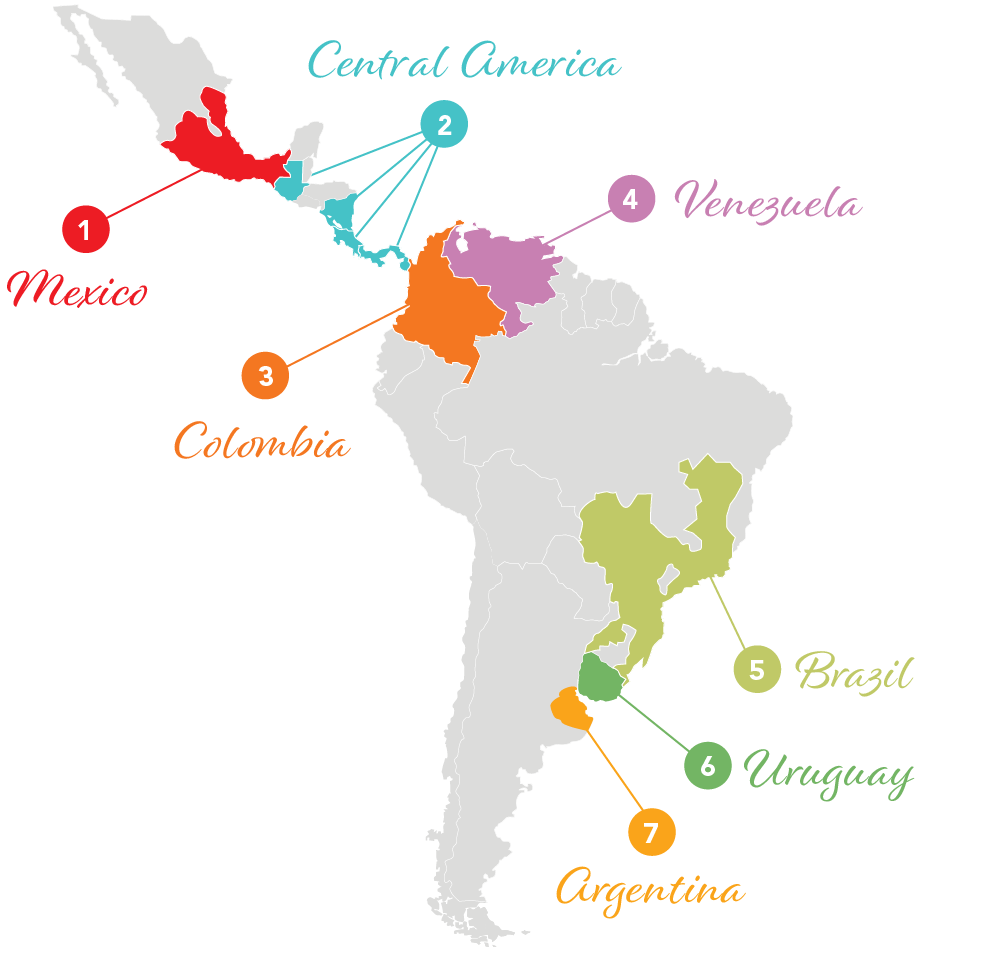
| Population served (million) |
Points of sale |
Plants | Distribution Centers |
|||||
|---|---|---|---|---|---|---|---|---|
1 Mexico |
74.6 | 864,638 | 17 | 145 | ||||
2 Central America |
32.9 |
181,142 |
7 | 56 | ||||
3 Colombia |
45.5 | 376,042 | 7 | 24 | ||||
4 Venezuela |
31.8 | 156,267 | 4 | 22 | ||||
5 Brazil |
88.8 | 403,059 | 10 | 40 | ||||
6 Uruguay |
3.5 | 25,360 | 1 | 6 | ||||
7 Argentina |
12.4 | 47,630 | 2 | 4 | ||||
| TOTAL | 289.5 | 2,054,038 | 48 | 297 |
| Volume* | Transactions* | |
|---|---|---|
 |
||
| Sparkling Beverages |
2,589 | 16,068 |
 |
||
| Water & Bulk Water |
518 | 1,690 |
 |
||
| Still Beverages |
214 | 1,968 |
| Product mix by category (% of volume of total beverages) | ||||||||
| Sparkling | Water1 | Bulk Water2 | Still | |||||
|---|---|---|---|---|---|---|---|---|
| Mexico | 72.9% | 5.6% | 15.0% | 6.5% | ||||
| Central America | 85.0% | 5.2% | 0.2% | 9.6% | ||||
| Colombia | 76.5% | 9.8% | 7.2% | 6.5% | ||||
| Brazil | 87.5% | 6.0% | 0.9% | 5.6% | ||||
| Uruguay | 91.6% | 6.9% | 0.0% | 1.5% | ||||
| Argentina | 80.4% | 9.9% | 2.6% | 7.1% | ||||
| 1 | Excludes still bottled water in presentations of 5.0 Lt. or larger. Includes flavored water. |
| 2 | Bulk water - still water in presentations of 5.0 Lt. or larger. Includes flavored water. |
| * | As of December 31, 2017, Venezuela is reported as an investment in shares, as a non-consolidated operation. |