Operating
Highlights
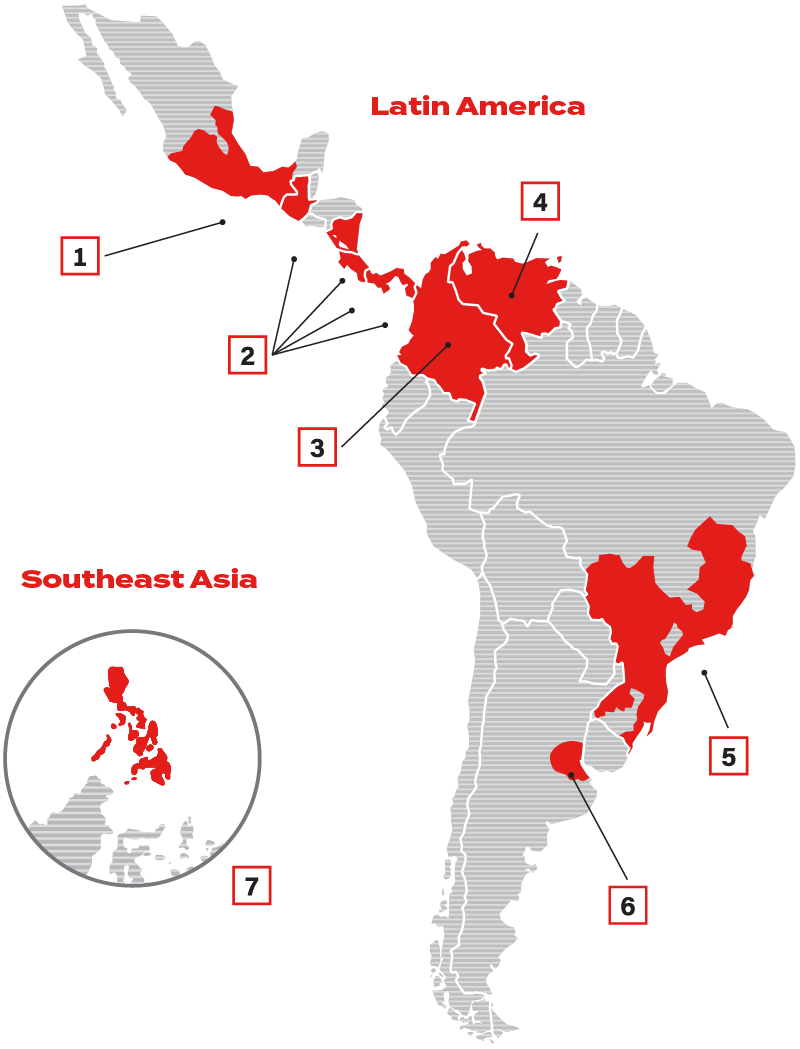
Aligned with our 8.9% volume growth, our total transactions in the Philippines rose 8.6% for the year, driven by the performance of our cola and flavored sparkling beverage categories.
| Population served (millions) |
Points of sale |
Plants | Distribution centers |
|
|---|---|---|---|---|
| 1 Mexico | 71.1 | 854,459 | 17 | 145 |
| 2 Central America |
21.3 | 125,778 | 5 | 34 |
| 3 Colombia |
46.9 | 401,234 | 7 | 24 |
| 4 Venezuela | 31.7 | 168,833 | 4 | 26 |
| 5 Brazil | 87.7 | 394,489 | 12 | 43 |
| 6 Argentina | 12.2 | 49,416 | 2 | 4 |
| 7 Philippines | 104.5 | 846,588 | 19 | 52 |
| Total | 375.4 | 2,840,797 | 66 | 328 |
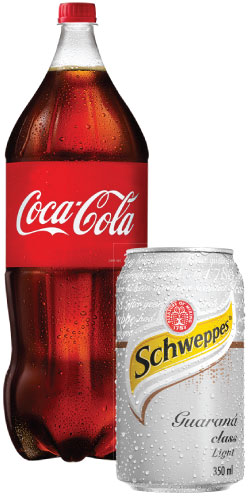
| Sparkling Beverages |
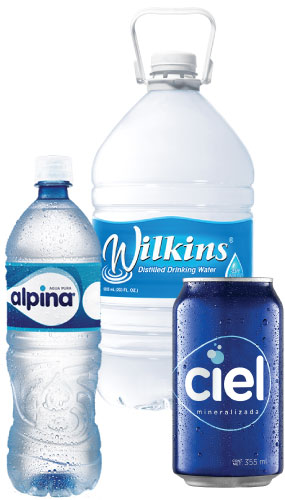
Water & Bulk Water |
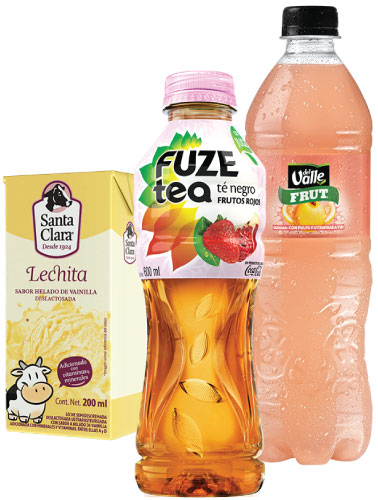
Still Beverages |
|
|---|---|---|---|
| Volume1 million unit cases |
2,589.2 | 531.7 | 213.0 |
 |
 |
 |
|
| Transactions1 millions |
16,033.1 | 1,718.3 | 2,022.9 |
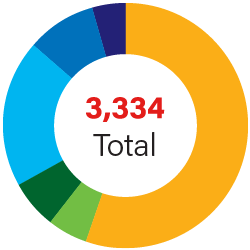
| Total Volume million unit cases |
||
|---|---|---|
| ● | Mexico | 1,851 |
| ● | Central America | 175 |
| ● | Argentina | 209 |
| ● | Brazil | 649 |
| ● | Colombia | 307 |
| ● | Venezuela | 143 |
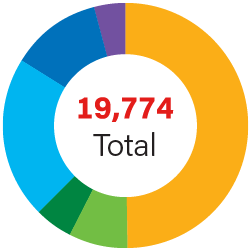
| Transactions million |
||
|---|---|---|
| ● | Mexico | 9,884 |
| ● | Central America | 1,498 |
| ● | Argentina | 1,013 |
| ● | Brazil | 4,206 |
| ● | Colombia | 2,401 |
| ● | Venezuela | 772 |


Product Mix by Package
% of volume of sparkling beverages
Returnable
Non-returnable


Product Mix by Size
% of volume of sparkling beverages
Multi-serve
Single-serve
| Product Mix by Category % of volume of total beverages |
Sparkling | Water2 | Bulk Water3 | Still |
|---|---|---|---|---|
| Mexico | 73.3% | 5.2% | 15.7% | 5.8% |
| Central America | 83.0% | 5.7% | 0.4% | 11.0% |
| Colombia | 73.8% | 9.0% | 6.9% | 10.3% |
| Venezuela | 83.8% | 9.1% | 0.9% | 6.2% |
| Brazil | 88.1% | 6.0% | 0.9% | 5.0% |
| Argentina | 80.7% | 11.1% | 1.6% | 6.6% |
| (1) | Excludes Philippines. |
| (2) | Excludes still bottled water in presentations of 5.0 Lt. or larger. Includes flavored water. |
| (3) | Bulk water - still water in presentations of 5.0 Lt. or larger. Includes flavored water. |