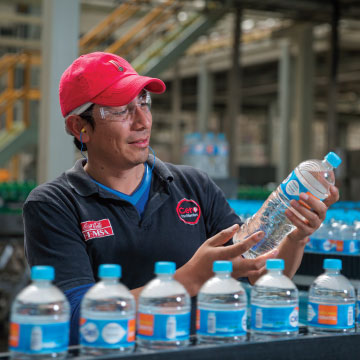
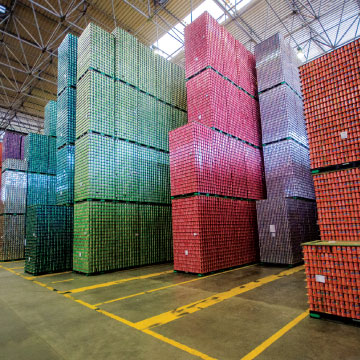
Thanks to our efficient resource management, optimization of our packaging materials, and light-weighting initiatives, we generated savings of US$24.4 million in 2017.
To strengthen our packaging capabilities, we further provided mandatory training, along with accompanying certification, across our plants in the proper use of 17 packaging materials. Through this special certification process, our plants must show clear enhancement across key packaging process indicators, while implementing corrective and improvement actions. This year, all of our operations earned “KOF Packaging Material Certification”.
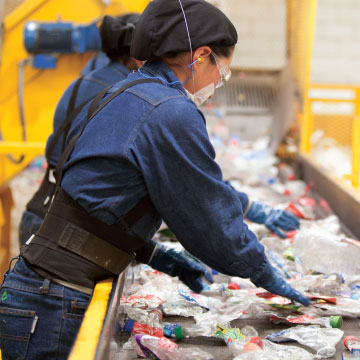
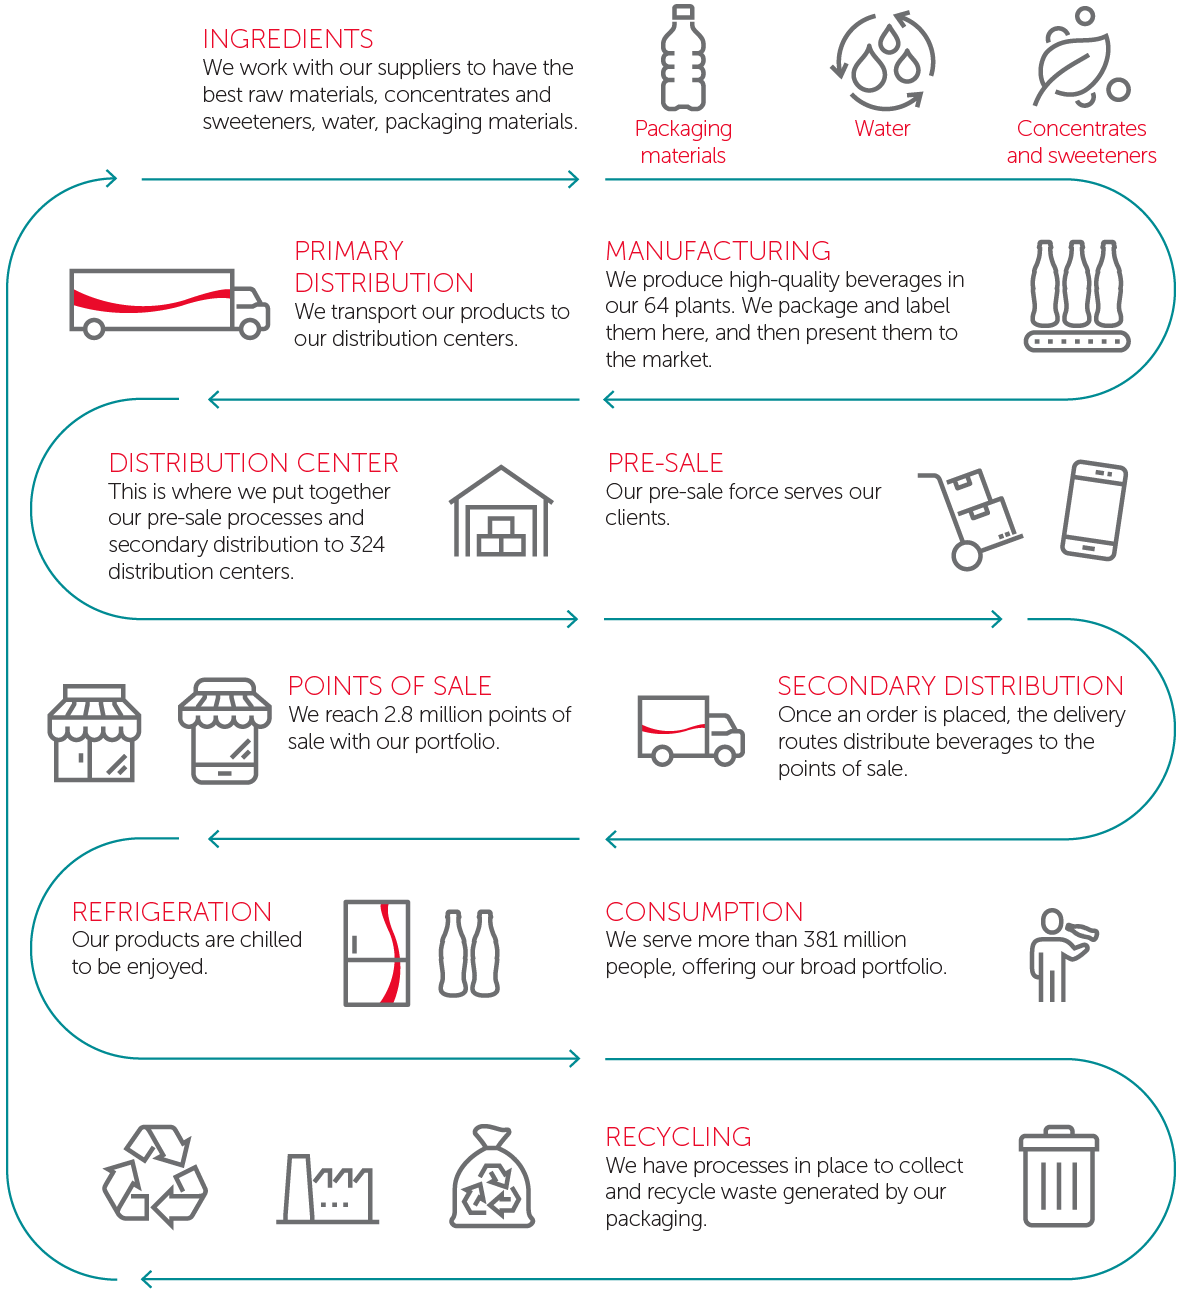
Post Consumption Collection & Recycling
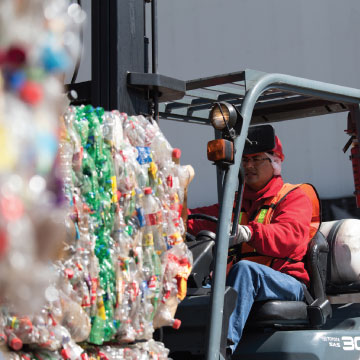
By joining efforts, we multiply the effects of our actions. Accordingly, as part of our collection and recycling efforts, we involve communities, authorities, and NGOs in the regions where we operate in different programs that promote the proper disposal and handling of the waste generated from consuming our products.
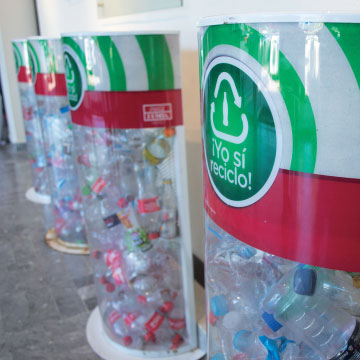
For over 15 years, we have collaborated with other food and beverage companies through ECOCE, a Mexican civil association that promotes the collection of waste, the creation of a national market for recycling, and the development of recycling programs. Thanks to this collaborative effort, in 2017, ECOCE collected 57% of the total PET waste in Mexico.
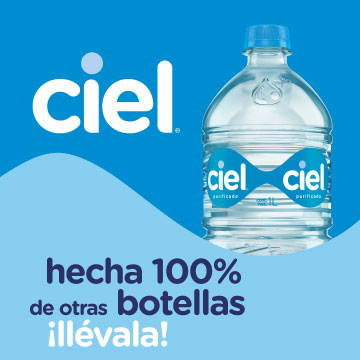
Furthermore, we are leaders in PET bottle-to-bottle recycling in Latin America. In Mexico, in 2005, we joined efforts to operate the first Food Grade PET Recycling Plant in Latin America, called IMER (Industria Mexicana de Reciclaje). In 2017, this plant recycled 12,415 tons of PET.
Overall, in 2017, we utilized a total of almost 59,202 tons of recycled and renewable materials in our plants in Argentina, Brazil, Central America, Colombia, and Mexico. As a result of these efforts, we have used more than 209,448 tons of recycled PET since 2010. Consequently, we have considerably reduced the amount of virgin materials we use in producing our packages, while lowering our plants’ energy consumption.
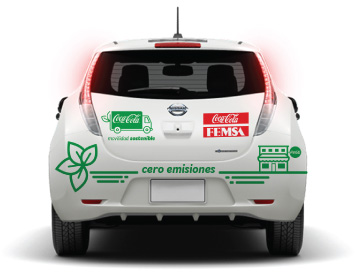
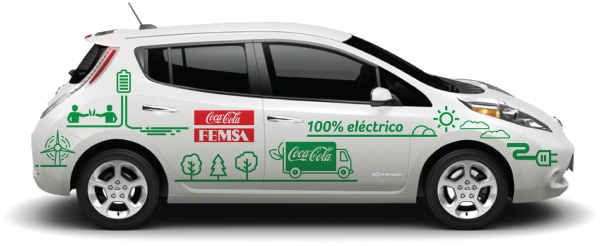
Aligning our efforts with The Coca-Cola Company, we embrace their global goal of helping to collect and recycle the equivalent of 100% of our packaging by 2030 through the “World Without Waste” initiative.


 water usage
 beverage produced1 (billions of liters)


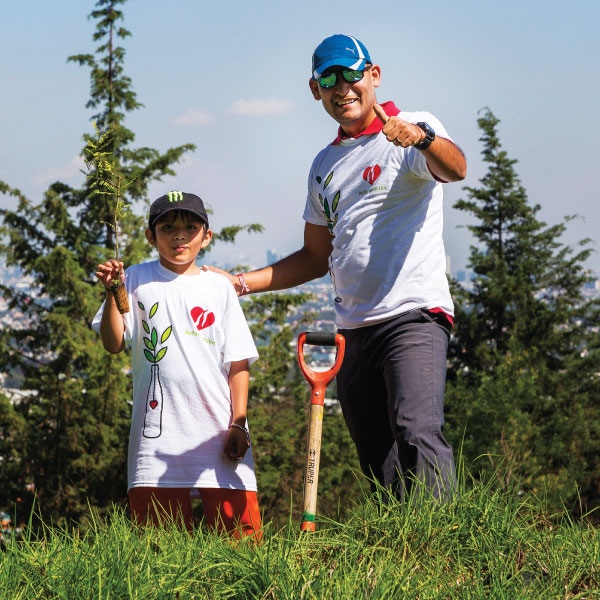
 we have planted 77 million trees in Mexico over the past 10 years.