OPERATING
highlights
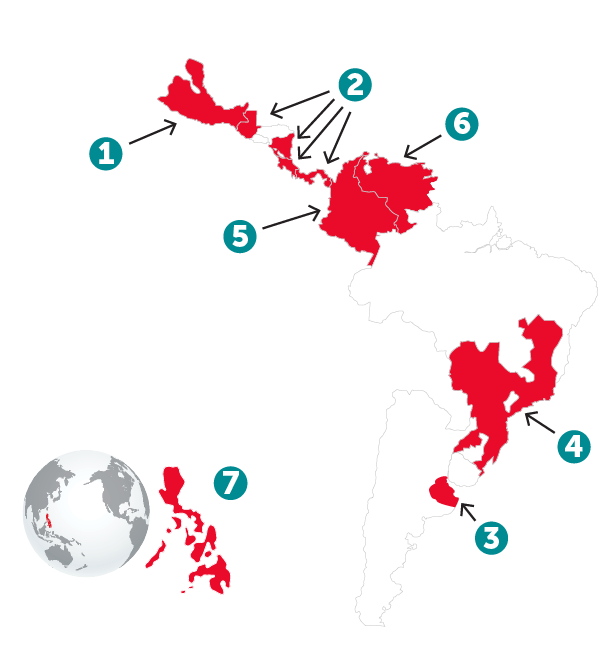
Population served (millions) |
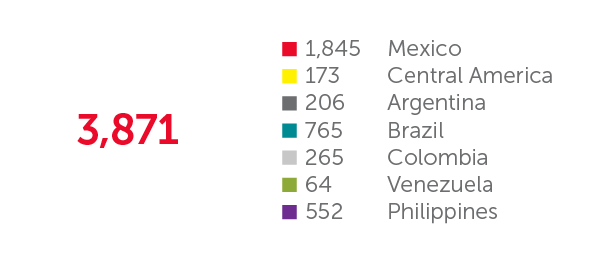
Points of sale |
Plants | Distribution Centers |
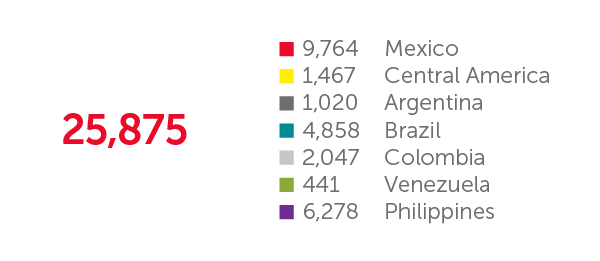
|
---|---|---|---|---|
1 Mexico |
72.1 | 853,430 | 17 | 145 |
2 Central America |
21.7 | 118,414 | 5 | 36 |
3 Argentina |
12.3 | 48,396 | 2 | 3 |
4 Brazil |
88.4 | 396,220 | 10 | 40 |
5 Colombia |
49.6 | 372,785 | 7 | 24 |
6 Venezuela |
32.1 | 158,563 | 4 | 24 |
7 Philippines |
104.9 | 818,502 | 19 | 52 |
TOTAL | 381.1 | 2,766,310 | 64 | 324 |
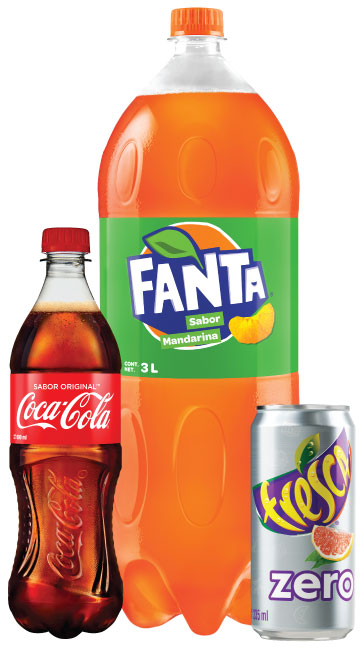
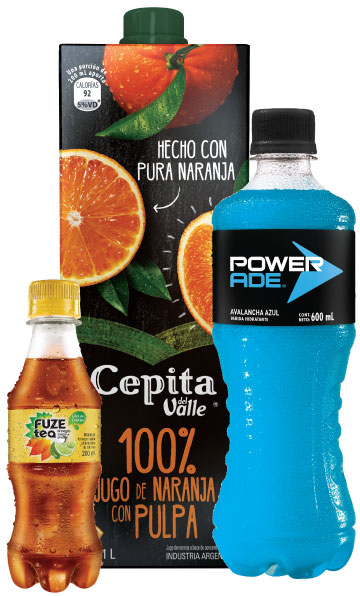
Sparkling Beverages |
Water & Bulk Water |
Still Beverages |
|||
---|---|---|---|---|---|
VOLUME1 |
3,028 | 580 | 263 | ||
TRANSACTIONS1 |
21,572 | 1,920 | 2,383 |
Total Volume1
million unit cases
Transactions1
million
We continue to improve our portfolio of affordable and returnable packages
Product mix by package
% of volume of sparkling beverages
returnable
non-returnable
Product mix by size
% of volume of sparkling beverages
single-serve
multi-serve
Sparkling | Water2 | Bulk Water3 | Still | |
---|---|---|---|---|
Mexico | 73.0% | 5.3% | 15.7% | 6.0% |
Central America | 82.5% | 6.1% | 0.4% | 11.0% |
Argentina | 80.7% | 9.9% | 1.8% | 7.6% |
Brazil | 88.9% | 5.3% | 0.9% | 4.9% |
Colombia | 75.4% | 9.8% | 6.4% | 8.4% |
Venezuela | 85.0% | 10.6% | 0.8% | 3.6% |
Philippines | 79.4% | 4.5% | 6.2% | 9.9% |
1 | Volume and transactions for the Philippines includes February to December. |
2 | Excludes still bottled water in presentations of 5.0 Lt. or larger. Includes flavored water. |
3 | Bulk water - still water in presentations of 5.0 Lt. or larger. Includes flavored water. |