
financial summary
Amounts expressed in millions of U.S. dollars and Mexican pesos, except data per share and headcount.
| U.S. (*) | 2020 | 2019 | 2018 (4) (5) (6) | 2017 (2) (3) (4) | 2016 (1) | |
|---|---|---|---|---|---|---|
| INCOME STATEMENT | ||||||
| Total revenues |
9,231 |
183,615 |
194,471 |
182,342 |
183,256 |
177,718 |
| Cost of goods solds |
5,068 |
100,804 |
106,964 |
98,404 |
99,748 |
98,056 |
| Gross profit |
4,163 |
82,811 |
87,507 |
83,938 |
83,508 |
79,662 |
| Operative expenses |
2,838 |
56,444 |
60,537 |
57,924 |
58,044 |
55,462 |
| Other expenses, net |
182 |
3,611 |
2,490 |
1,881 |
31,357 |
3,812 |
| Comprehensive financing result |
336 |
6,678 |
6,071 |
6,943 |
5,362 |
6,080 |
|
Income before income taxes and share of the profit or of associates and joint ventures accounted for using the equity method |
808 |
16,077 |
18,409 |
17,190 |
(11,255) |
14,308 |
| Income taxes |
273 |
5,428 |
5,648 |
5,260 |
4,184 |
3,928 |
| Share in the (loss) profit of equity accounted investees, net of taxes |
(14) |
(281) |
(131) |
(226) |
60 |
147 |
| Consolidated net income |
521 |
10,368 |
12,630 |
15,070 |
(11,654) |
10,527 |
| Equity holders of the parent |
518 |
10,307 |
12,101 |
10,936 |
(16,058) |
10,070 |
| Non-controlling interest net income |
3 |
61 |
529 |
768 |
679 |
457 |
| RATIOS TO REVENUES (%) | ||||||
| Gross margin |
45.1 |
45.1 |
45.0 |
46.0 |
45.6 |
44.8 |
| Net income margin |
5.6 |
5.6 |
6.5 |
8.3 |
(6.4) |
5.9 |
| CASH FLOW | ||||||
| Operative cash flow |
1,767 |
35,147 |
31,289 |
29,687 |
33,236 |
32,446 |
| Capital expenditures (7) |
521 |
10,354 |
11,465 |
11,069 |
14,612 |
12,391 |
| Total cash, cash equivalents |
2,187 |
43,497 |
20,491 |
23,727 |
18,767 |
10,476 |
| BALANCE SHEET | ||||||
| Current assets |
3,642 |
72,440 |
56,796 |
57,490 |
55,657 |
45,453 |
| Investment in shares |
383 |
7,623 |
9,751 |
10,518 |
12,540 |
22,357 |
| Property, plant and equipment, net |
2,989 |
59,460 |
61,187 |
61,942 |
75,827 |
65,288 |
| Intangible assets, net |
5,227 |
103,971 |
112,050 |
116,804 |
124,243 |
123,964 |
| Deferred charges and other assets, net |
920 |
18,294 |
16,673 |
17,033 |
17,410 |
22,194 |
| Total Assets |
13,225 |
263,066 |
257,839 |
263,787 |
285,677 |
279,256 |
| Liabilities | ||||||
| Short-term bank loans and notes payable |
253 |
5,017 |
11,485 |
11,604 |
12,171 |
3,052 |
| Interest payable |
36 |
712 |
439 |
497 |
487 |
520 |
| Other current liabilities |
1,865 |
37,116 |
39,086 |
33,423 |
42,936 |
36,296 |
| Long-term bank loans and notes payable |
4,145 |
82,461 |
58,492 |
70,201 |
71,189 |
85,857 |
| Other long-term liabilities |
770 |
15,303 |
18,652 |
16,312 |
18,184 |
24,298 |
| Total Liabilities |
7,069 |
140,609 |
128,154 |
132,037 |
144,967 |
150,023 |
| Equity |
6,156 |
122,457 |
129,685 |
131,750 |
140,710 |
129,233 |
| Non-controlling interest in consolidated subsidiaries |
281 |
5,583 |
6,751 |
6,806 |
18,141 |
7,096 |
| Equity attributable to equity holders of the parent |
5,875 |
116,874 |
122,934 |
124,944 |
122,569 |
122,137 |
| FINANCIAL RATIOS (%) | ||||||
| Current |
1.69 |
1.69 |
1.11 |
1.26 |
1.00 |
1.14 |
| Leverage |
1.15 |
1.15 |
0.99 |
1.00 |
1.03 |
1.16 |
| Capitalization |
0.43 |
0.43 |
0.37 |
0.41 |
0.39 |
0.41 |
| Coverage |
5.13 |
5.13 |
5.51 |
4.22 |
4.20 |
4.80 |
| DATA PER SHARE | ||||||
| Book Value (8) |
0.350 |
6.954 |
7.315 |
7.434 |
7.293 |
7.365 |
| Loss (income) tributable to the holders of the parent (9) |
0.030 |
0.610 |
0.723 |
0.831 |
(0.765) |
0.607 |
| Dividends paid (10) |
0.031 |
0.608 |
0.443 |
0.419 |
0.422 |
0.419 |
| Headcount (11) |
82,334 |
82,334 |
82,186 |
83,364 |
79,636 |
85,140 |
Information considers full-year of KOF’s territories and one month of Vonpar Refrescos, S.A. ("Vonpar").
Income statement information considers full-year of KOF’s territories and full-year of Coca-Cola FEMSA Venezuela.
Balance sheet information does not include Coca-Cola FEMSA Venezuela's balances due to deconsolidation as of December 31, 2017.Coca-Cola FEMSA Venezuela balance is included as investement in shares as of December 31, 2017.
KOF Philippines has been classified as a discontinued operation in our profit and loss statement for the years ended December 31, 2017 and 2018.
Income statement information includes 8 months of the financial results for Abasa and Los Volcanes in Guatemala.
Income statement information includes six months in the financial results for Uruguay.
Includes investments in property, plant and equipment, refrigeration equipment and returnable bottles and cases, net of disposals of property, plant and equipment.
Based on 16,806.7 million ordinary shares as of December 31, 2020, 2019, 2018 and 2017, and 16,583.4 million shares as of December 31, 2016.
Computed based on the weighted average number of shares outstanding during the periods presented:16,806.7 million for 2020, 2019 and 2018, 16,730.8 million in 2017 and 16,730.8 million in 2016.
Dividends paid during the year based on the prior year's net income, using 16,806.7 millions outstanding ordinary shares for 2020, 2019 and 2018 and 16,583.4 million oustanding ordinary shares for paid on 2017 and 2016.
Includes third-party and for 2017 excludes 16,566 employees for our discontinued operation in Phillipines.
* Exchange rate as of December 31, 2020 Ps. 19.89 per U.S. dollar solely for the convenience of the reader according to the federal USA reserve.
management discussion & analysis
Results for the Year Ended December 31, 2020
Compared to the Year Ended December 31, 2019
Consolidated Results
The comparability of our financial and operating performance in 2020 as compared to 2019 was affected by the following factors: (1) translation effects from fluctuations in exchange rates; and (2) our results in Argentina, which since January 1, 2018 has been considered a hyperinflationary economy. For the convenience of the reader, we have included a discussion of the financial information below on a comparable basis, excluding the translation effects from fluctuations in exchange rates. To translate the full-year results of Argentina for the years ended December 31, 2020 and 2019, we used the exchange rate at December 31, 2020 of 84.15 Argentine pesos per U.S. dollar and the exchange rate at December 31, 2019 of 59.89 Argentine pesos per U.S. dollar, respectively. The depreciation of the exchange rate of the Argentine peso at December 31, 2020, as compared to the exchange rate at December 31, 2019, was 40.5%. In addition, the average depreciation of currencies used in our main operations relative to the U.S. dollar in 2020, as compared to 2019, were: 11.6% for the Mexican peso, 30.7% for the Brazilian real, and 12.6% for the Colombian peso.
Total Revenues. Our consolidated total revenues decreased by 5.6% to Ps.183,615 million in 2020 as compared to 2019, mainly as a result of unfavorable price-mix effects due to the COVID-19 pandemic and currency translation effects resulting from the depreciation of all of our operating currencies in South America against the Mexican peso, particularly the Brazilian real, which had a 14.5% unfavorable translation effect. These effects were partially offset by favorable pricing and revenue management initiatives. Total revenues include other operating revenues related to entitlements to reclaim tax payments in Brazil in 2020. See Note 25.2.1 to our consolidated financial statements. On a comparable basis, total revenues would have decreased by 1.0% in 2020 as compared to 2019.
Total sales volume decreased by 2.5% to 3,284.4 million unit cases in 2020 as compared to 2019, mainly as a result of social distancing and other measures adopted as a result of the COVID-19 pandemic, which had an adverse effect on our points of sale.
In 2020, sales volume of our sparkling beverage portfolio decreased by 1.1%, sales volume of our colas portfolio decreased by 0.2%, and sales volume of our flavored sparkling beverage portfolio decreased by 5.0%, in each case as compared to 2019.
Sales volume of our still beverage portfolio decreased by 5.0% in 2020 as compared to 2019.
Sales volume of our bottled water category, excluding bulk water, decreased by 22.6% in 2020 as compared to 2019.
Sales volume of our bulk water category increased by 0.6% in 2020 as compared to 2019.
Consolidated average price per unit case decreased by 3.5% to Ps.50.63 in 2020, as compared to Ps. 52.46 in 2019, mainly as a result of unfavorable price-mix effects and the negative translation effect resulting from the depreciation of most of our operating currencies relative to the Mexican peso. This was partially offset by price increases aligned with or above inflation. On a comparable basis, average price per unit case would have remained flat at 0.3% in 2020 as compared to 2019, driven by our revenue management and pricing initiatives.
Gross Profit. Our gross profit decreased by 5.4% to Ps.82,811 million in 2020 as compared to 2019; with a gross margin increase of 10 basis points as compared to 2019 to reach 45.1% in 2020. This gross margin increase was mainly driven by our pricing initiatives, together with lower PET resin costs and stable sweetener prices in most of our operations, which were partially offset by higher concentrate costs in Mexico, higher concentrate costs in Brazil due to the reduction of tax credits on concentrate purchased from the Manaus Free Trade Zone, coupled with our decision to suspend such tax credits, and the depreciation in the average exchange rate of most of our operating currencies as applied to U.S. dollar-denominated raw material costs. On a comparable basis, our gross profit would have decreased by 1.3% in 2020 as compared to 2019.
The components of cost of goods sold include raw materials (principally concentrate, sweeteners and packaging materials), depreciation costs attributable to our production facilities, wages and other labor costs associated with labor force employed at our production facilities and certain overhead costs. Concentrate prices are determined as a percentage of the retail price of our products in local currency, net of applicable taxes. Packaging materials, mainly PET resin and aluminum, and HFCS, used as a sweetener in some countries, are denominated in U.S. dollars.
Administrative and Selling Expenses. Our administrative and selling expenses decreased by 6.8% to Ps.56,444 million in 2020 as compared to 2019. Our administrative and selling expenses as a percentage of total revenues decreased by 40 basis points to 30.7% in 2020 as compared to 2019, mainly as a result of operating expense efficiencies in labor, maintenance and marketing. In 2020, we continued investing across our territories to support marketplace execution, increase our cooler coverage, and bolster our returnable presentation base.
Other Expenses Net. We recorded other expenses net of Ps.3,611 million in 2020 as compared to Ps.2,490 million in 2019, which increase was mainly as a result of an extraordinary other operating expenses related to impairments in Estrella Azul in Panama and in Leão Alimentos, our non-carbonated beverage associate in Brazil, which were partially offset by the implementation of our efficiency program to create a leaner and more agile organization. For more information, see Note 10 to our consolidated financial statements.
Comprehensive Financing Result. he term “comprehensive financing result” refers to the combined financial effects of net interest expenses, net financial foreign exchange gains or losses, and net gains or losses on the monetary position of hyperinflationary countries where we operate. Net financial foreign exchange gains or losses represent the impact of changes in foreign exchange rates on financial assets or liabilities denominated in currencies other than local currencies, and certain gains or losses resulting from derivative financial instruments. A financial foreign exchange loss arises if a liability is denominated in a foreign currency that appreciates relative to the local currency between the date the liability is incurred and the date it is repaid, as the appreciation of the foreign currency results in an increase in the amount of local currency, which must be exchanged to repay the specified amount of the foreign currency liability.
Comprehensive financing result in 2020 recorded an expense of Ps.6,678 million as compared to an expense of Ps.6,071 million in 2019. This 10.0% increase was mainly driven by a one-time interest expense related to the repurchase and redemption in full of our 3.875% senior notes due 2023. In addition, we incurred short-term financing as a preventive measure to reinforce our cash position. These effects were partially offset by debt prepayments.
Income Taxes. In 2020, our effective income tax rate was 33.8%, reaching Ps.5,428 million in 2020, as compared to Ps.5,648 million in 2019. Our effective income tax rate increased in 2020 as compared to 2019 as a result of impairments of approximately Ps.2,349 million recognized during the period and an increase in income credit taxes. For more information, see Note 25 to our consolidated financial statements.
Share in the Loss of Equity Accounted Investees, Net of Taxes. In 2020, we recorded a loss of Ps.281 million in the share in the loss of equity accounted investees, net of taxes, mainly due to the results of Leão Alimentos, our associate in Brazil, and Estrella Azul in Panama.
Net Income (Equity holders of the parent). We reported a net controlling interest income of Ps.10,307 million in 2020, as compared to Ps.12,101 million in 2019. This 14.8% decrease was mainly driven by lock-downs and social distancing measures related to the COVID-19 pandemic coupled with impairments on equity method investees recognized during the year, which were partially offset by our cost saving, revenue management and pricing initiatives.
Results by Consolidated Reporting Segment
Mexico and Central America
Total Revenues. Total revenues in our Mexico and Central America consolidated reporting segment decreased by 2.3% to Ps.106,783 million in 2020 as compared to 2019, mainly as a result of a volume decline in Mexico coupled with unfavorable price-mix effects across our markets.
Total sales volume in our Mexico and Central America consolidated reporting segment decreased by 4.0% to 1,991.6 million unit cases in 2020 as compared to 2019, as a result of mobility restrictions and social distancing measures related to the COVID-19 pandemic.
Sales volume of our sparkling beverage portfolio decreased 3.7% in 2020 as compared to 2019, driven by a decline in our colas and flavored sparkling beverage portfolio.
Sales volume of our still beverage portfolio decreased by 6.7% in 2020 as compared to 2019, due to declines in sales volume in both Mexico and Central America.
Sales volume of bottled water, excluding bulk water, decreased by 26.5% in 2020 as compared to 2019, due to declines in sales volume in both Mexico and Central America.
Sales volume of our bulk water portfolio remained flat in 2020 as compared to 2019.
Sales volume in Mexico decreased by 4.3% to 1,759.2 million unit cases in 2020, as compared to 1,838.3 million unit cases in 2019, mainly as a result of mobility restrictions and social distancing measures related to the COVID-19 pandemic.
Sales volume of our sparkling beverage portfolio decreased in 2020 as compared to 2019, driven by a decline in our colas and flavored sparkling beverage portfolio.
Sales volume of our still beverage portfolio decreased by 4.9% in 2020 as compared to 2019.
Sales volume of bottled water, excluding bulk water, decreased by 26.0% in 2020 as compared to 2019.
Sales volume of our bulk water portfolio increased by 0.5% in 2020 as compared to 2019.
Sales volume in Central America decreased by 1.9% to 232.4 million unit cases in 2020, as compared to 236.9 million unit cases in 2019, mainly as a result of mobility restrictions and social distancing measures related to the COVID-19 pandemic.
Sales volume of our sparkling beverage portfolio increased by 1.3% in 2020 as compared to 2019, driven by a 3.4% increase in colas.
Sales volume of our still beverage portfolio decreased by 16.8% in 2020 as compared to 2019.
Sales volume of bottled water, excluding bulk water, decreased by 29.9% in 2020 as compared to 2019.
Sales volume of our bulk water portfolio declined by 20.9% in 2020 as compared to 2019.
Gross Profit. Our gross profit in this consolidated reporting segment increased by 1.0% to Ps.52,906 million in 2020 as compared to 2019 and gross profit margin increased by 160 basis points to 49.5% in 2020 as compared to 2019. Gross profit margin increased mainly as a result of our pricing initiatives, cost efficiencies and lower PET costs, coupled with our raw material and currency hedging strategies. These factors were partially offset by unfavorable price-mix effects, higher concentrate costs in Mexico and the depreciation in the average exchange rate of most of our operating currencies as applied to our U.S. dollar-denominated raw material costs.
Administrative and Selling Expenses. Administrative and selling expenses as a percentage of total revenues in this consolidated reporting segment decreased by 50 basis points to 32.4% in 2020 as compared to the same period in 2019. Administrative and selling expenses, in absolute terms, decreased by 3.5% in 2020 as compared to 2019 driven mainly by our ability to drive savings and operating expense efficiencies primarily in labor, maintenance and marketing in Mexico.
South America
Total Revenues. Total revenues in our South America consolidated reporting segment decreased by 9.8% to Ps.76,831 million in 2020 as compared to 2019, mainly as a result of unfavorable price-mix and currency translation effects resulting from the depreciation of most of our operating currencies as compared to the Mexican peso. This figure includes other operating revenues related to entitlements to reclaim tax payments in Brazil in 2020. See Note 25.2.1 to our consolidated financial statements. Total revenues for beer amounted to Ps.15,228 million in 2020. On a comparable basis, total revenues would have increased by 3.6% in 2020 as compared to 2019.
Total sales volume in our South America consolidated reporting segment remained stable at 1,292.7 million unit cases in 2020 as compared to 2019, mainly as a result of volume growth in Brazil.
Sales volume of our sparkling beverage portfolio increased by 1.6% in 2020 as compared to 2019.
Sales volume of our still beverage portfolio decreased by 1.9% in 2020 as compared to 2019.
Sales volume of our bottled water category, excluding bulk water, decreased by 18.3% in 2020 as compared to 2019.
Sales volume of our bulk water portfolio increased by 2.5% in 2020 as compared to 2019.
Sales volume in Brazil increased by 1.9% to 862.9 million unit cases in 2020, as compared to 846.5 million unit cases in 2019.
Sales volume of our sparkling beverage portfolio increased by 2.8% in 2020 as compared to 2019, as a result of growth in our colas and flavored sparkling beverage portfolio.
Sales volume of our still beverage portfolio decreased by 1.2% in 2020 as compared to 2019.
Sales volume of our bottled water, excluding bulk water, decreased by 9.4% in 2020 as compared to 2019.
Sales volume of our bulk water portfolio increased by 18.8% in 2020 as compared to 2019.
Sales volume in Colombia decreased by 4.0% to 254.8 million unit cases in 2020, as compared to 265.5 million unit cases in 2019.
Sales volume of our sparkling beverage portfolio increased by 0.9% in 2020 as compared to 2019, mainly driven by growth in our flavored sparkling beverage portfolio.
Sales volume of our still beverage portfolio decreased by 8.7% in 2020 as compared to 2019.
Sales volume of bottled water, excluding bulk water, decreased by 33.8% in 2020 as compared to 2019.
Sales volume of our bulk water portfolio decreased by 13.7% in 2020 as compared to 2019.
Sales volume in Argentina decreased by 3.9% to 133.8 million unit cases in 2020, as compared to 139.3 million unit cases in 2019.
Sales volume of our sparkling beverage portfolio decreased by 2.8% in 2020 as compared to 2019, mainly impacted by a decline in our flavored sparkling beverage portfolio.
Sales volume of our still beverage portfolio increased by 3.5% in 2020 as compared to 2019.
Sales volume of bottled water, excluding bulk water, decreased by 32.0% in 2020 as compared to 2019.
Sales volume of our bulk water portfolio increased by 48.4% in 2020 as compared to 2019.
Sales volume in Uruguay decreased by 2.8% to 41.2 million unit cases in 2020, as compared to 42.4 million unit cases in 2020.
Sales volume of our sparkling beverage portfolio decreased by 5.1% in 2020 as compared to 2019.
Sales volume of our still beverage portfolio increased by 36.2% in 2020 as compared to 2019.
Sales volume of bottled water increased by 18.0% in 2020 as compared to 2019.
Gross Profit. Gross profit in this consolidated reporting segment amounted to Ps.29,905 million, a decrease of 14.9% in 2020 as compared to 2019, with a 230 basis point margin contraction to 38.9%. This decrease in gross profit was mainly driven by an unfavorable price-mix effect and the depreciation of the average exchange rate of all of our operating currencies in the division as applied to our U.S. dollar-denominated raw material costs. These factors were partially offset by lower PET costs and our revenue management initiatives.
Administrative and Selling Expenses. Administrative and selling expenses as a percentage of total revenues in this consolidated reporting segment decreased by 50 basis points to 28.4% in 2020 as compared to 2019 driven mainly by operating expense efficiencies in Brazil. Administrative and selling expenses, in absolute terms, decreased by 11.5% in 2020 as compared to 2019.
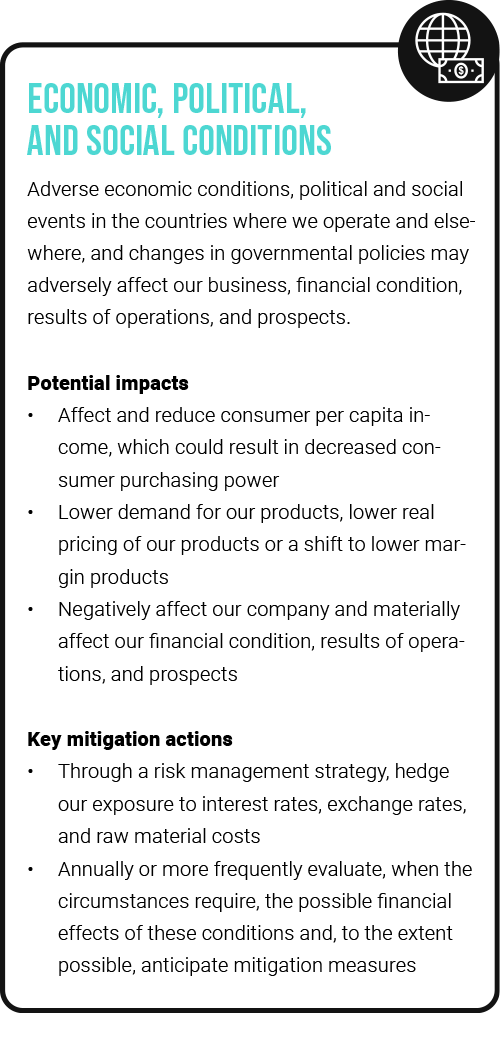
Comprehensive risk management
Our company is present in different countries and regions. Consequently, we are continually exposed to an environment that presents challenges and risks. Our ability to manage the risks that may arise in the global environment where we operate is vital for our business’ value creation. Accordingly, our strategy includes a Comprehensive Risk Management Process through which we are able to identify, measure, register, assess, prevent, and/or mitigate risks.


Capital & Company Engagement

Human
Our people and the way they work together are our company’s most valuable assets. Accordingly, we encourage their comprehensive professional and personal development, while creating an inclusive, diverse, and safe work environment. Through our continuous talent management and development, we promote trust, transparency, and teamwork, prepare the next generation of leaders, advance meritocracy, recognize and celebrate teams’ success, while providing honest, regular feedback. In this way, we look to attract, retain, and develop the best multicultural talent to ensure our sustainable success.

nature
Our business is committed to the responsible use of natural resources. As the main ingredient in our beverages, our comprehensive water strategy focuses on ensuring efficient water management, facilitating access to safe water and sanitation, and implementing water conservation and replenishment projects to protect the environment. We also work to increase energy efficiency across our value chain, while integrating clean and renewable energy to reduce carbon emissions. Aligned with The Coca-Cola Company’s “World Without Waste” global initiative, we continue to focus on comprehensive and responsible waste management, to increase the use of recycled materials in our packaging, and to participate in schemes and models that support post-consumption collection and recycling.

social & Relationship
Our communities and other stakeholders are key enablers of business success. Therefore, we are committed to creating economic and social value and environmental wellbeing by encouraging dialogue and continuous interaction with our neighbors and stakeholders in order to develop and implement programs and initiatives that address their particular needs and guarantee the continuity of our social license to operate.

Financial
Our financial and operating discipline, strong capital structure and financial flexibility, transformational digital initiatives, and adaptability to changing market dynamics enable us to capture organic and inorganic growth opportunities in our industry, while creating sustainable value for our investors.

Intellectual
We are accelerating our digitally driven business transformation throughout the value chain. We are further capturing the insights from our powerful analytical platform to develop tailored business models. By building our critical capabilities, we are creating a stronger, more agile, and flexible organization to drive our competitiveness, proactively address industry challenges, capitalize on market opportunities, and foster intellectual development across our organization.

Manufactured
Our highly experienced team of specialists operate 49 bottling plants and 268 distribution centers across nine countries, deliver approximately 3.3 billion unit cases of beverages through a primary and secondary fleet to nearly 2 million points of sale, and serve a population of more than 265 million people.
corporate governance
Executive Officers
John Santa Maria Otazua
Chief Executive Officer
Constantino Spas Montesinos
Chief Financial Officer
Karina Paola Awad Pérez
Human Resources Officer
José Ramón Martínez
Corporate Affairs Officer
Rafael Ramos Casas
Supply Chain and Engineering Officer
Rafael Alberto Suárez Olaguíbel¹
Information Technology and Commercial Officer
Fabricio Ponce García
Chief Operating Officer – Mexico
Ian M. Craig García
Chief Operating Officer - Brazil
Eduardo G. Hernández Peña
Chief Operating Officer - LATAM
Xiemar Zarazua López
Commercial Development Officer
board of directors
Directors Appointed by Series a Shareholders
José Antonio Fernández Carbajal
Executive Chairman of the Board of Directors of FEMSA
28 years as a Board Member
Federico José Reyes García
Independent Consultant
28 years as a Board Member
Alternate: Javier Gerardo Astaburuaga Sanjines
John Santa Maria Otazua
Chief Executive Officer of Coca-Cola FEMSA
7 years as a Board Member
Ricardo Guajardo Touché²
Chairman of the Board of Directors of SOLFI, S.A. de C.V.
28 years as a Board Member
Enrique F. Senior Hernández²
Managing Director of Allen & Company, LLC.
17 years as a Board Member
Eduardo Padilla Silva
Chief Executive Officer of FEMSA
5 years as a Board Member
Luis Rubio Freidberg²
President of the Board of Directors of México Evalúa
6 years as a Board Member
Alternate: Jaime A. El Koury
Daniel Servitje Montull²
Chief Executive Officer and Chairman of the Board of Directors of Bimbo
23 years as a Board Member
José Luis Cutrale
Chairman of the Board of Directors of Sucocítrico Cutrale, LTDA.
17 years as a Board Member
Alternate: José Henrique Cutrale
Luis Alfonso Nicolau Gutiérrez²
Partner at Ritch, Mueller, Heather y Nicolau, S.C., Law Firm; Member of the Firm´s Executive Committee
3 years as a Board Member
Directors Appointed by Series D Shareholders
José Octavio Reyes Lagunes
Retired
5 years as a Board Member
Alternate: Theresa Robin Rodgers Moore
John Murphy
Executive Vice President and Chief Financial Officer of The Coca-Cola Company
2 years as a Board Member
Alternate: Sunil Krishna Ghatnekar
Charles H. McTier²
Retired
23 years as a Board Member
James Leonard Dinkins
Senior Vice President of The Coca-Cola Company and President of Coca-Cola North America (CCNA)
1 year as a Board Member
Alternate:Marie D. Quintero-Johnson
Directors Appointed by Series L Shareholders
Víctor Alberto Tiburcio Celorio²
Independent Consultant
3 years as a Board Member
Francisco Zambrano Rodríguez²
Managing Partner of Forte Estate Plannning S.C.
18 years as a Board Member
Alfonso González Migoya²
Business consultant and Managing Partner of Acumen Empresarial, S.A. de C.V.
15 years as a Board Member
Secretary of Board
Carlos Eduardo Aldrete Ancira
General Counsel of FEMSA
27 years as a Secretary
Alternate: Carlos Luis Díaz Sáenz
As of January 1, 2021, Mr. Ignacio Echevarria assumed the position of Chief Information Officer, reporting directly to our CEO. Mr. Echevarria assumed the IT responsibilities that were previously overseen by Mr. Suárez, who will continue to focus his role in transformation and commercial development.
Independent
Board of practices
Planning and Finance Committee
The Planning and Finance Committee works with management to set our annual and long-term strategic and financial plans and monitors adherence to these plans. It is responsible for setting our optimal capital structure and recommends the appropriate level of borrowing as well as the issuance of securities. Financial risk management is another responsibility of the Planning and Finance Committee. Ricardo Guajardo Touché is the chairman of the Planning and Finance Committee. The other members include: Federico Reyes García, John Murphy, Enrique F. Senior Hernández and Miguel Eduardo Padilla Silva. The secretary non-member of the Planning and Finance Committee is Constantino Spas Montesinos, our Chief Financial Officer.
Audit Committee
The Audit Committee is responsible for reviewing the accuracy and integrity of quarterly and annual financial statements in accordance with accounting, internal control and auditing requirements. The Audit Committee is directly responsible for the appointment, compensation, retention and oversight of the independent auditor, who reports directly to the Audit Committee (such appointment and compensation being subject to the approval of our board of directors); the internal auditing function also reports to the Audit Committee. The Audit Committee has implemented procedures for receiving, retaining and addressing complaints regarding accounting, internal control and auditing matters, including the submission of confidential, anonymous complaints from employees regarding questionable accounting or auditing matters. To carry out its duties, the Audit Committee may hire independent counsel and other advisors. As necessary, we compensate the independent auditor and any outside advisor hired by the Audit Committee and provide funding for ordinary administrative expenses incurred by the Audit Committee in the course of its duties. Victor Alberto Tiburcio Celorio is the chairman of the Audit Committee and the “audit committee financial expert.” Pursuant to the Mexican Securities Market Law, the chairman of the Audit Committee is elected at our shareholders meeting. The other members are: Alfonso González Migoya, Charles H. McTier and Francisco Zambrano Rodríguez. Each member of the Audit Committee is an independent director, as required by the Mexican Securities Market Law and applicable New York Stock Exchange listing standards. The secretary non-member of the Audit Committee is José González Ornelas, vice-president of FEMSA’s internal corporate control department.
Corporate Practices Committee
The Corporate Practices Committee, which consists exclusively of independent directors, is responsible for preventing or reducing the risk of performing operations that could damage the value of our company or that benefit a particular group of shareholders. The committee may call a shareholders meeting and include matters on the agenda for that meeting that it deems appropriate, approve policies on related party transactions, approve the compensation plan of the chief executive officer and relevant officers, and support our board of directors in the elaboration of related reports. The chairman of the Corporate Practices Committee is Daniel Javier Servitje Montull. Pursuant to the Mexican Securities Market Law, the chairman of the Corporate Practices Committee is elected at our shareholders meeting. The other members include: Jaime A. El Koury, Luis Rubio Freidberg, Luis A. Nicolau Gutiérrez, and two permanent non-member guests, Miguel Eduardo Padilla Silva and José Octavio Reyes Lagunes. The secretary non-member of the Corporate Practices Committee is Karina Paola Awad Pérez, our Human Resources Officer.
integral ethical system
Through our ethical culture, we manage under schemes that must be adopted as a way of life that inspires the acts and actions of all those who are part of the organization through the establishment of an Ethical System.
Our ethical management is based on:
Prevent illicit behaviors that may affect our human capital and our heritage.
Detect improper acts through open communication channels.
Respond and provide feedback to our organization to build trust.
Therefore, our system is comprised of three fundamental elements: the Code of Ethics, an Ethics Committee and the whistleblowing system known as KOF Ethics Line.
Our Code of Ethics
It is the basis of our organizational culture, communicates our values, contemplates our main behaviors, promotes good behavior inside and outside our organization and guides our correct decision-making based on ethical principles. Our Code, recently updated, includes important topics such as Human Rights, Inclusion and Diversity, Discrimination, Violence and Harassment, Conflicts of interests, Misuse of information and Anti-corruption.
Our Ethics Committee
It is the oversight and control body, which guarantees compliance with the Code of Ethics and attends to the most relevant ethical situations of the company. In each of our territories, there is an Ethics Committee and each Committee reports to the Corporate Ethics Committee.
Our KOF Ethics Line
whistleblowing system
Complaints about noncompliance with the Code of Ethics are received through the KOF Ethics Line, which is managed by a third-party. Employees, customers, suppliers, third parties or anyone who has a relationship with Coca-Cola FEMSA can use the system anonymously.
A group of investigators analyzes the complaints impartially and confidentially and, if a violation of the Code is found, corrective measures are applied.
In 2020, we received 1,367 complaints; of these, none were related to child labor, forced labor or freedom of association.
To strengthen our culture, our workers sign a Letter of Compliance to our Code of Ethics. Its purpose is to ensure that our employees are aware of the Code of Ethics, understand the main acts or omissions that may be incurred and can put at risk to our organization and that they must report any violation of the Code that they know.


shareholder & analyst information
Investor Relations
Jorge Collazo
Lorena Martin
Bryan Carlson
Marene Aranzabal
[email protected]
Sustainabiity & Corporate
Communication
Juan Carlos Cortés
Carlos Valle
Pedro Incháustegui
[email protected]
Coca-Cola FEMSA, S.A.B. de C.V.
Mario Pani N° 100
Col. Santa Fe Cuajimalpa 05348,
Ciudad de Mexico, México
(5255) 1519 5000
www.coca-colafemsa.com
Legal Counsel of the Company
Carlos L. Díaz Sáenz
Marío Pani N° 100
Col. Santa Fe Cuajimalpa 05348,
Ciudad de Mexico, México
Phone: (5255) 1519 5000
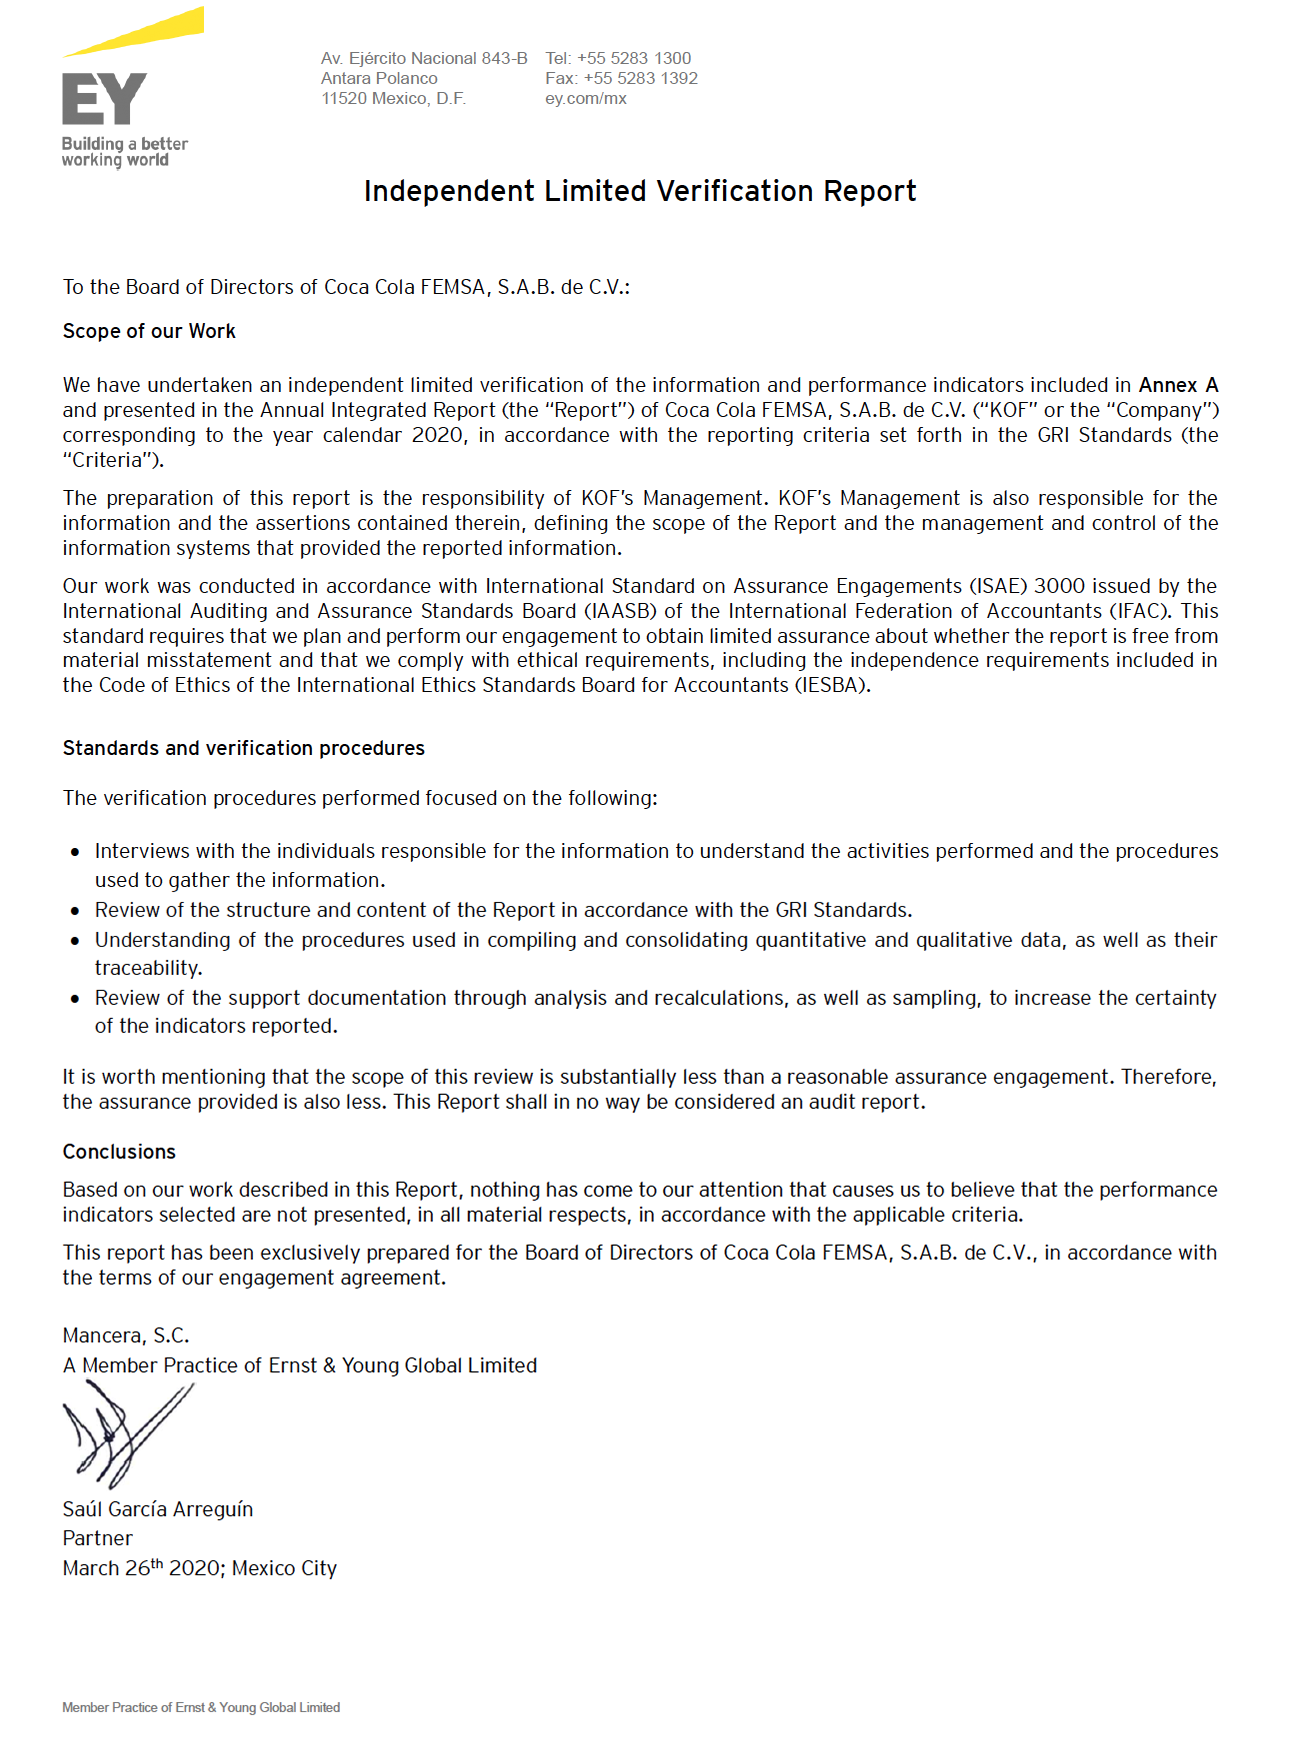
Independent Accountants
Mancera, S.C.
A member firm of Ernst & Young Global
Antara Polanco
Av. Ejército Nacional Torre Paseo 843-B Piso 4
Colonia Granada 11520
Ciudad de Mexico, México
Phone: (5255) 5283 1400
Stock Exchange Information
Coca-Cola FEMSA’s common stock is traded
on the Bolsa Mexicana de Valores, (the Mexican Stock Exchange) under the symbol KOFUBL and on the New York Stock Exchange, Inc. (NYSE) under the symbol KOF.
Transfer Agent and Registrar
Bank of New York
101 Barclay Street 22W
New York, New York 10286, U.S.A
KOF
New York Stock Exchange
Quarterly Stock Information
| U.S. Dollars per ADS | 2020 | ||
|---|---|---|---|
|
Quarter Ended |
$ High | $ Low | $ Close |
| dec-31 | 46.93 | 36.20 | 46.10 |
| sep-30 | 44.91 | 39.63 | 40.72 |
| jun-30 | 48.39 | 38.09 | 43.85 |
| mar-31 | 64.95 | 38.44 | 40.23 |
| U.S. Dollars per ADS | 2019 | ||
|---|---|---|---|
|
Quarter Ended |
$ High | $ Low | $ Close |
| dec-31 | 61.98 | 54.98 | 60.62 |
| sep-30 | 63.12 | 57.27 | 60.62 |
| jun-28 | 68.51 | 62.03 | 62.14 |
| mar-29 | 66.75 | 58.29 | 66.00 |
KOFUBL
Mexican Stock Exchange
Quarterly Stock Information
| Mexican Pesos | 2020 | ||
|---|---|---|---|
|
Quarter
Ended |
$ High | $ Low | $ Close |
| dec-31 | 93.88 | 77.30 | 91.51 |
| sep-30 | 100.3 | 86.26 | 90.19 |
| jun-30 | 106.29 | 91.49 | 100.62 |
| mar-31 | 121.02 | 90.56 | 95.65 |
| Mexican Pesos | 2019 | ||
|---|---|---|---|
|
Quarter
Ended |
$ High | $ Low | $ Close |
| dec-31 | 121.01 | 105.71 | 114.88 |
| sep-30 | 122.57 | 112.93 | 120.09 |
| jun-28 | 130.07 | 119.05 | 119.11 |
| mar-29 | 128.31 | 114.28 | 128.31 |
About Our Integrated Report
From our headquarters in Mexico City, we present our Integrated Report 2020 edition. This report was developed following the guidelines of the International Integrated Reporting Council (IIRC) and in accordance with the GRI (Global Reporting Initiative) Standards, as well as material indicators of the SASB (Sustainability Accounting Standards) for the Non-Alcoholic Beverage Industry. Furthermore, this report elaborates on our annual Communication on Progress (COP) to the United Nations Global Compact, included by FEMSA in its 2020 report.
The information contained in this report corresponds to the period from January 1 to December 31, 2020. It includes data from all of the countries where Coca-Cola FEMSA, S.A.B. de C.V. has operations or a majority share. Its operations encompass franchise territories in Mexico, Brazil, Guatemala, Colombia, and Argentina, and, nationwide, in Costa Rica, Nicaragua, Panama, and Uruguay.
For comparability purposes, the non-financial quantitative data for 2020, 2019, and 2018 is represented without Venezuela, since as of December 31, 2017, Venezuela is a deconsolidated operation reported as an investment in shares. Moreover, the 2017 information is represented without the Philippines.
CHIEF FINANCIAL OFFICER
Constantino Spas Montesinos
CORPORATE AFFAIRS OFFICER
José Ramón Martínez Alonso
Stock listing information: Mexican Stock Exchange,
Ticker: KOFUBL | NYSE (ADS),
Ticker: KOF | Ratio of KOFUBL to KOF = 10:1
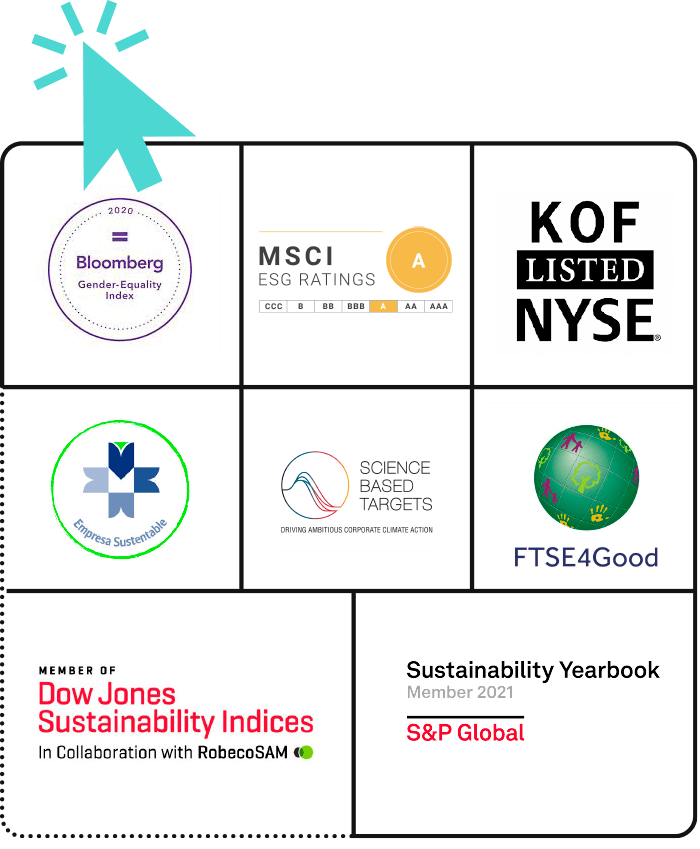
Coca-Cola FEMSA files reports, including annual reports and other information with the U.S. Securities and Exchange Commission, or the “SEC,” and the Mexican Stock Exchange (Bolsa Mexicana de Valores, or the “BMV”) pursuant to the rules and regulations of the SEC (that apply to foreign private issuers) and of the BMV. Filings we make electronically with the SEC and the BMV are available to the public on the Internet at the SEC’s website at www.sec.gov, the BMV’s website at www.bmv.com.mx, and our website at www.coca-colafemsa.com. Coca-Cola FEMSA, S.A.B. de C.V. is the largest Coca-Cola franchise bottler in the world by sales volume. The company produces and distributes trademark beverages of The Coca-Cola Company, offering a wide portfolio of 129 brands to a population of more than 265 million. With over 80 thousand employees, the company markets and sells approximately 3.3 billion unit cases through close to 2 million points of sale a year. Operating 49 manufacturing plants and 268 distribution centers, Coca-Cola FEMSA is committed to generating economic, social, and environmental value for all of its stakeholders across the value chain. The company is a member of the Dow Jones Sustainability Emerging Markets Index, Dow Jones Sustainability MILA Pacific Alliance Index, FTSE4Good Emerging Index, and the S&P/BMV Total Mexico ESG Index, among others. Its operations encompass franchise territories in Mexico, Brazil, Guatemala, Colombia, and Argentina, and, nationwide, in Costa Rica, Nicaragua, Panama, Uruguay, and in Venezuela through its investment in KOF Venezuela.
For further information, please visit
www.coca-colafemsa.com
stakeholders
We maintain a permanent and open communication with stakeholders, identified based on the materiality assessment we carried out in 2012. This communication helps us understand the interests and concerns of the people who are related, directly or indirectly, to our business activities. We select the stakeholders based on their relationship with each aspect of our value chain, impacts to our operations, and the relevance they hold as part of our purpose of creating shared value.

|
Whistleblower |
01-800 |
e-mail / |
Working |
Community |
Dialogue |
Participation |
Area responsible |
Main issues |
|
|---|---|---|---|---|---|---|---|---|---|
| Associates and their Families | Human Resources | Business philosophy, work culture, labor relations. | |||||||
| Community | Corporate Affairs, Commercial, Human Resources | Community development programs, portfolio of products, job openings, safety at the work centers. | |||||||
| Clients and Consumers | Commercial, Marketing | Different information requests, portfolio of products, job openings, sponsorships, technical assistance, and sales. | |||||||
| Suppliers | Procurement | Commercial relationships. | |||||||
| Shareholders and Investors | Investor Relations | Financial results, company strategy, investment plans, economic prospects. | |||||||
| Authorities and Business Associations | Corporate Affairs | Collaboration in community development initiatives and environmental stewardship. | |||||||
| Unions | Human Resources | Negotiations for collective bargaining contracts, labor relations. | |||||||
| Civil Society Organizations | Corporate Affairs | Joint projects. | |||||||
| Communications Media | Corporate Affairs | Business strategy, financial results, community development programs and environmental stewardship, institutional positioning. | |||||||
| Education Institutes | Human Resources, Corporate Affairs | Joint projects, academic advice, research, training. |
Business engagement
We are interested in promoting and exchanging best practices in Sustainability, and we actively participate in associations and organisms of the countries where we are present.
Coca-Cola FEMSA
Argentina
Brazil
Costa Rica
Guatemala
Mexico
Nicaragua
Panama
Uruguay
Business engagement
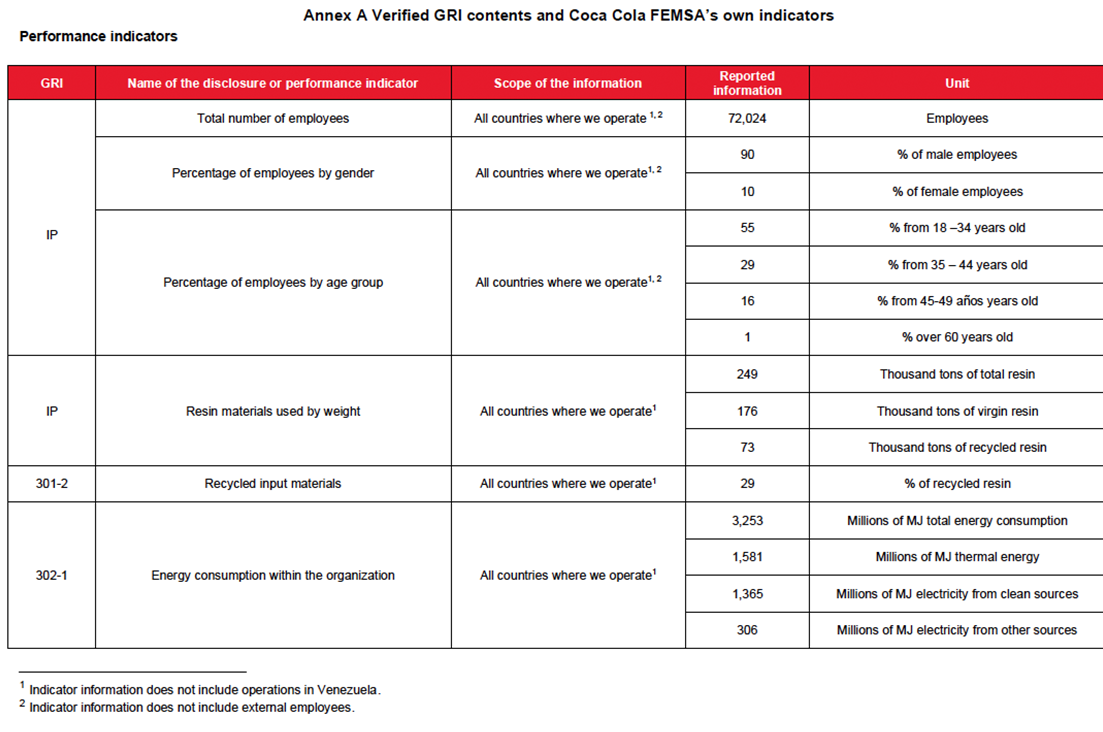
Gri content index
GRI 102 General Disclosures
GRI 103 Management Approach
GRI 201 Economic Performance
GRI 203 Indirect Economic Impacts
GRI 204 Procurement Practices
GRI 205 Anti-corruption
GRI 206 Anti-competitive Behavior
GRI 301 Materials
GRI 302 Energy
GRI 303 Water and Effluents
GRI 305 Emissions
GRI 306 Effluents and Waste
GRI 401 Employment
GRI 402 Labor/Management Relations
GRI 403 Occupational Health and Safety
GRI 404 Training and Education
GRI 405 Diversity and Equal Opportunity
GRI 406 Non-discrimination
GRI 407 Freedom of Association and Collective Bargaining
GRI 408 Child Labor
GRI 409 Forced or Compulsory Labor
GRI 411 Rights of Indigenous Peoples
GRI 412 Human Rights Assessment
GRI 413 Local Communities
GRI 414 Supplier Social Assessment
GRI 416 Customer Health and Safety
SASB index
Energy Management
Water Management
Health & Nutrition
Product Labeling & Marketing
Packaging Lifecycle Management
Environmental & Social Impacts of Ingredient Supply Chain
Activity Metrics